Monitoring S3 Bandwidth Costs with AWS Lambda and New Relic Insights
TweetThis article is a translation of AWS Lambda と NewRelic Insightsを使って S3の転送量を監視する by Degica developer Taku Nakajima.
At Degica we use a wide variety of AWS services, but none costs us more than Amazon’s Simple Storage Service (S3), which we use heavily for hosting software downloads (particularly free trial software). Nearly half of our total monthly costs come from bandwidth fees on S3, where usage can fluctuate rapidly, rising during sales and when new products are released.
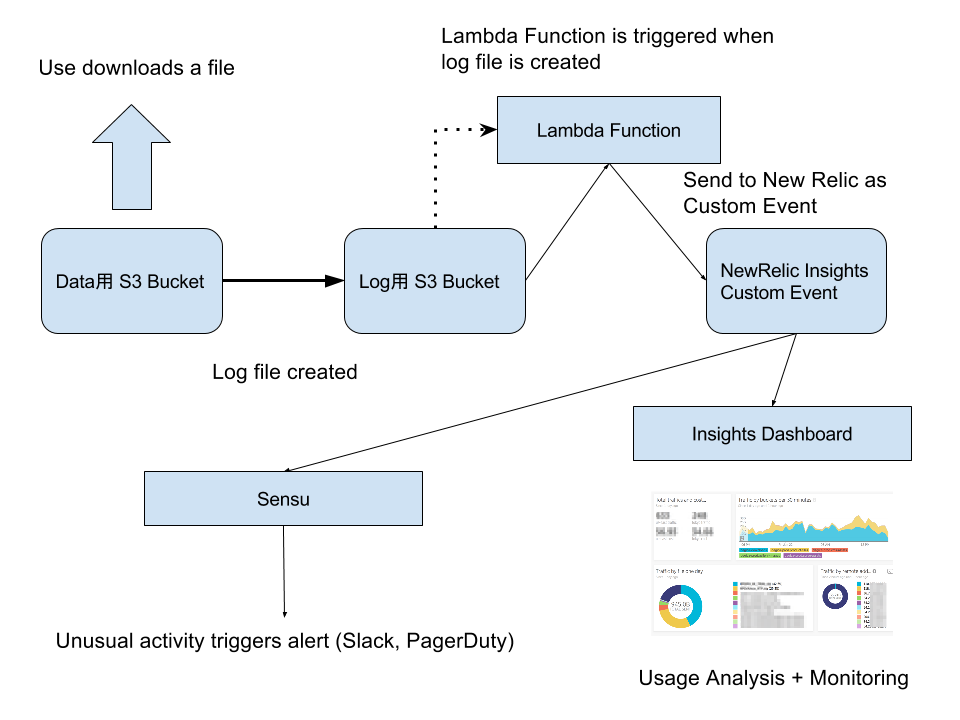
In order to assess and contain these costs, we need to monitor the volume of S3 downloads and, where appropriate, identify the source of cost fluctuations. The solution we’ve come up with combines a number of different tools and services:
- S3 access logs
- NewRelic Custom Events triggered by AWS Lambda functions
- Log analysis by NRQL
- Usage Monitoring by Sensu
In this blog post I’ll explain how we use these together to effectively analyze and monitor our S3 bandwidth usage.
New Relic Insights is a real-time platform allowing you to send data to an API and then graph it in a dashboard for analysis. We use many New Relic services at Degica; in this post I’ll focus on our use of New Relic Insights as a data management tool.
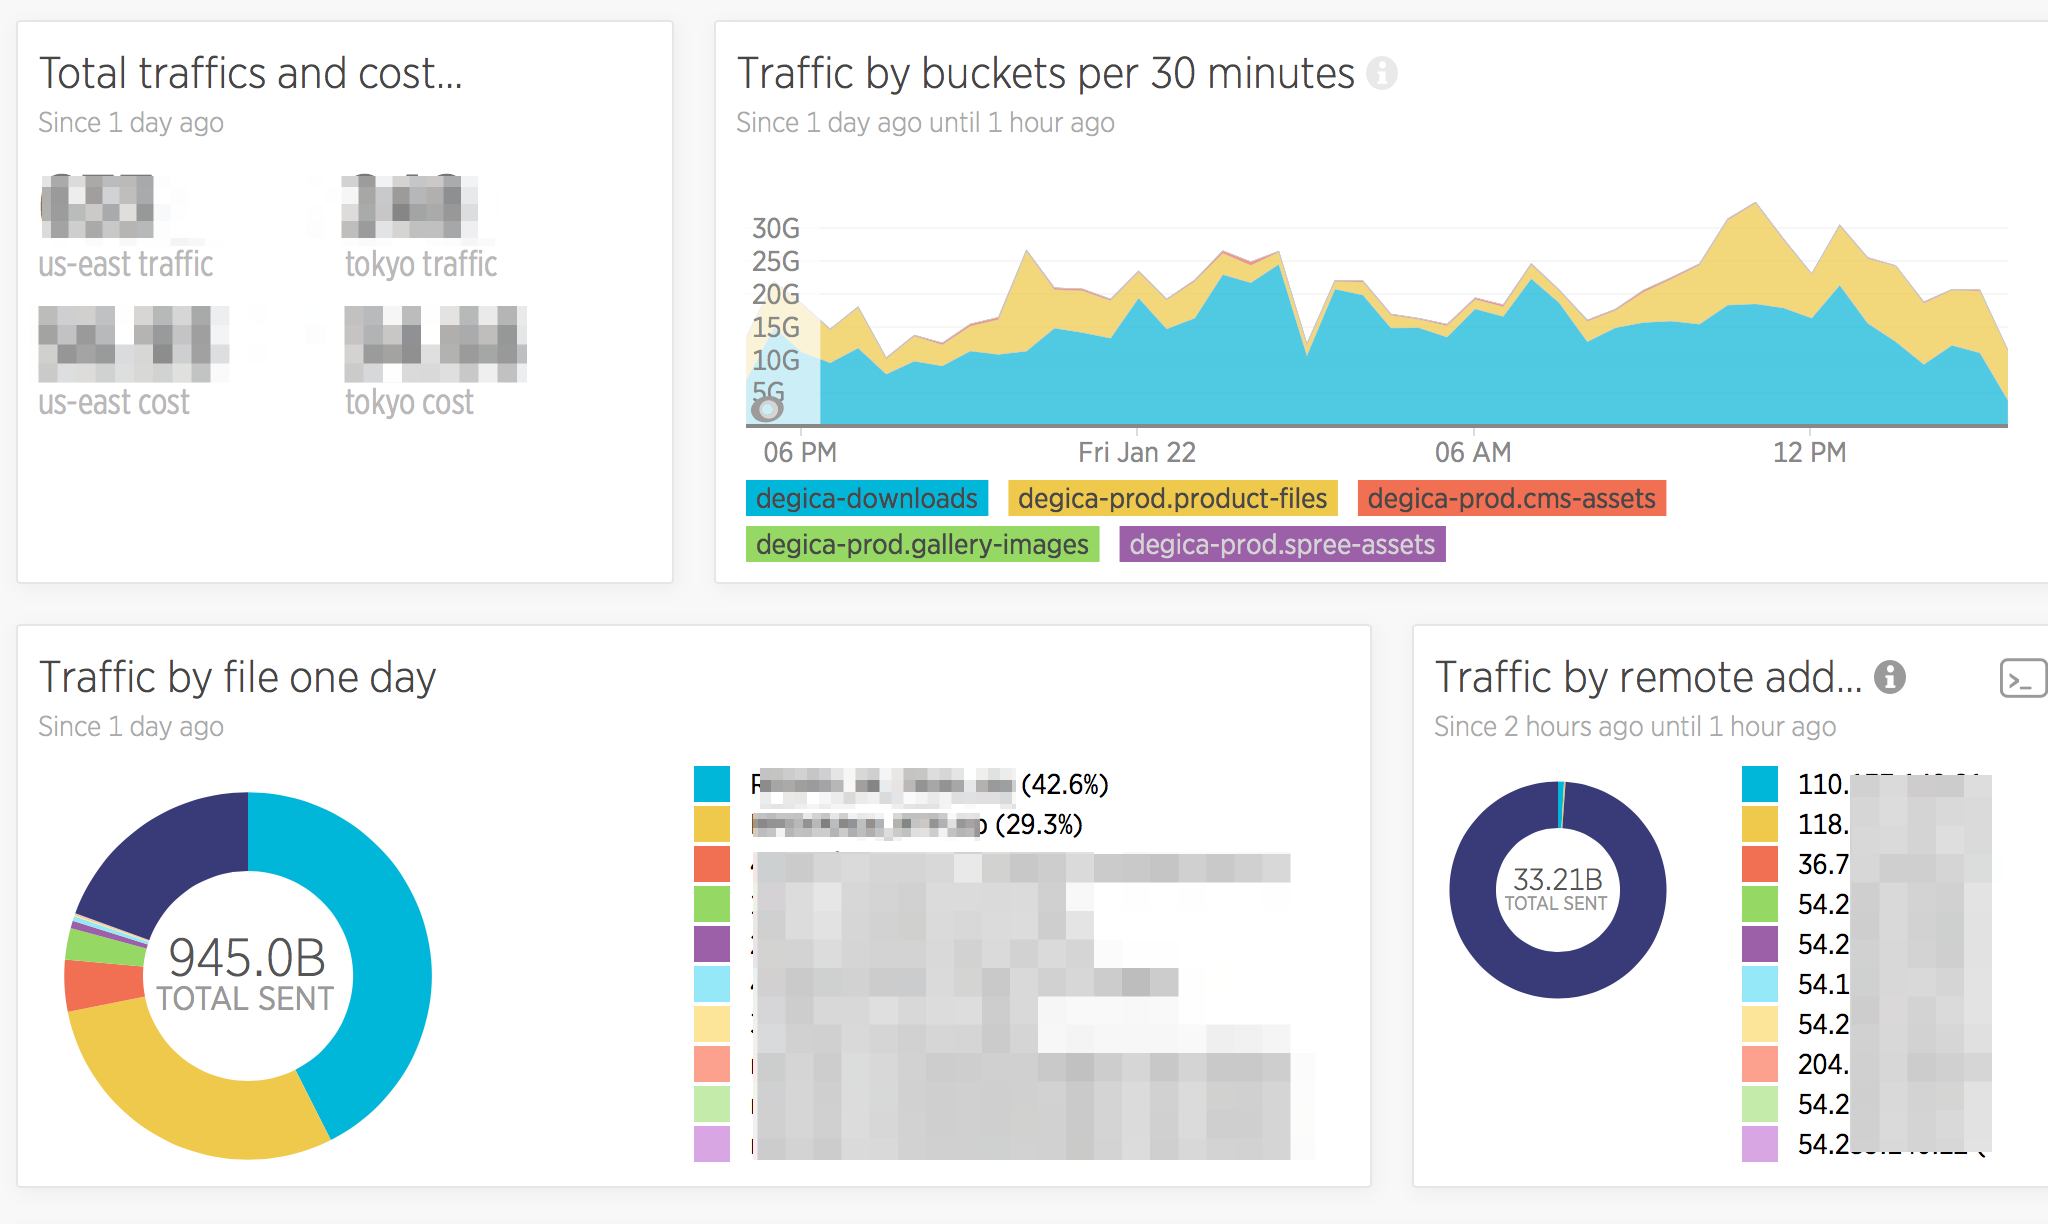
Insights stores data and allows you to create a dashboard to view that data using custom queries. Below is the dashboard I created.
I have included below the AWS Lambda Function which forwards logs to New Relic, the key element of this analysis setup. If you have a New Relic paid account, you can use this code to do the same analysis I describe below.
S3 Access Logs
There is an option in S3 buckets to enable logging, which is turned off by default. If you set the target bucket and prefix, S3 will store logs for the current bucket at that location.
Although it is possible to use the bucket itself as its own target, in order to use the Lambda Function described below please set it to a different bucket specifically for storing logs.
The logs generated by S3 look like this:
79a59df900b949e55d96a1e698fbacedfd6e09d98eacf8f8d5218e7cd47ef2be mybucket [06/Feb/2014:00:00:38 +0000] 192.0.2.3 79a59df900b949e55d96a1e698fbacedfd6e09d98eacf8f8d5218e7cd47ef2be 3E57427F3EXAMPLE REST.GET.VERSIONING - "GET /mybucket?versioning HTTP/1.1" 200 - 113 - 7 - "-" "S3Console/0.4" -
79a59df900b949e55d96a1e698fbacedfd6e09d98eacf8f8d5218e7cd47ef2be mybucket [06/Feb/2014:00:00:38 +0000] 192.0.2.3 79a59df900b949e55d96a1e698fbacedfd6e09d98eacf8f8d5218e7cd47ef2be 891CE47D2EXAMPLE REST.GET.LOGGING_STATUS - "GET /mybucket?logging HTTP/1.1" 200 - 242 - 11 - "-" "S3Console/0.4" -
79a59df900b949e55d96a1e698fbacedfd6e09d98eacf8f8d5218e7cd47ef2be mybucket [06/Feb/2014:00:00:38 +0000] 192.0.2.3 79a59df900b949e55d96a1e698fbacedfd6e09d98eacf8f8d5218e7cd47ef2be A1206F460EXAMPLE REST.GET.BUCKETPOLICY - "GET /mybucket?policy HTTP/1.1" 404 NoSuchBucketPolicy 297 - 38 - "-" "S3Console/0.4" -
For more information on the access log format, see the link below:
Recording NewRelic Custom Events using AWS Lambda
I created a Lambda Function to record this file as NewRelic Insights custom events, which I explain below.
Setup
Rename lambda-config.sample.js to lambda-config.js, and update the following settings:
- region: The region of your data bucket.
- role: The IAM Role ARN (Amazon Resource Name) for the function to use.
- functionName: Change if necessary.
Enable the AmazonS3ReadOnlyAccess and CloudWatchLogsFullAccess policies on the IAM Role used above.
Rename src/config.sample.js to src/config.js and update the following settings:
- exports.insertKey: Your NewRelic Insert API Key.
- exports.accountId: Your NewRelic Account ID.
An explanation of these settings is provided in the document below:
With these settings, use the commands below to upload the script:
$ npm install
$ gulp deploy
Last, we need to set the trigger. In the AWS Web Console Lambda you will see the function you uploaded. Set it to be the “Event Source” and adjust the settings as below:
- Event Source Type: S3
- Bucket: Name of the log bucket
- Event Type: Object Created (ALL)
- Prefix/Suffix: Anything (blank ok)
Log analysis with NRQL
Once the settings above are in place, wait a little while for the log data to be sent to Insights. Select “S3Logs” from Custom Events in the Data Explorer to check that data is being sent correctly. You can analyze log data in New Relic Insights using “NRQL”, an SQL-like query language.
Below are the queries I am using:
Analyze total data sent every 1m30s (per bucket)
SELECT sum(sent) FROM S3Logs SINCE 1 days ago until 1 hour ago TIMESERIES 30 minutes FACET bucket
Similar to GROUP BY in SQL, the FACET keyword allows you to group results by a particular column or expression.
Total data sent per IP address in 1 recent hour
SELECT sum(sent) FROM S3Logs FACET remoteAddr since 2 hours ago until 1 hour ago
This is used to check if any single user is downloading a large quantity of files. since 1 hour ago would also be okay, but there is an average 1 hour lag before S3 logs are sent, so instead I use since 2 hours ago until 1 hour ago to account for that lag.
Analyzing distribution of traffic by file
SELECT sum(sent) , count(sent), average(sent) from S3Logs FACET path since 1 day ago
Analyzing usage per referrer for a given bucket
SELECT sum(sent) , count(sent), average(sent) from S3Logs where bucket != 'degica-xxxxxxx' FACET referrer SINCE 1 day ago
I check these queries about once a day. When a traffic pattern looks out of the norm, I adjust FACET, WHERE and SINCE, and sometimes also write ad-hoc queries to further analyze the S3 data.
Calculating approximate total cost
SELECT filter(sum(sent)/(1024*1024*1024) , WHERE bucket = 'degica-xxxxxx') as 'us-east traffic', filter(sum(sent)/(1024*1024*1024) , WHERE bucket != 'degica-xxxxxx') as 'tokyo traffic', filter(sum(sent)*0.09/(1024*1024*1024) , WHERE bucket = 'degica-downloads') as 'us-east cost', filter(sum(sent)*0.14/(1024*1024*1024) , WHERE bucket != 'degica-xxxxxx') as 'tokyo cost' from S3Logs since 1 day ago
S3 bandwidth costs vary by region, so I divide results by region and calculate usage and costs per region, then sum these totals. (‘degica-xxxxxx’ is us-east, the rest are in Tokyo.)
NRQL queries can be entered in the “Query” field in New Relic Insights. Insights auto-completes field and keyword names so it’s really easy to write queries.
There is a tab to show results as a graph, so it’s easy to quickly convert aggregate results into a graph format. Once you store that graph in a dashboard, you can also quickly call it back.
Monitoring usage totals and variation with Sensu
I also wrote a script which I use as a Sensu plugin that runs queries on custom events and checks the results:
#!/bin/bash

NRQL='SELECT sum(sent) FROM S3Logs FACET remoteAddr since 2 hours ago'
NRQL_ENCODED=`echo "$NRQL" | sed -e 's/ /%20/g' -e 's/(/%28/g' -e 's/)/%29/g' `
QUERY_KEY='[query api key for your account]'
ACCOUNT_ID='[your account]'

RESULT=`curl -s -H "Accept: application/json" -H "X-Query-Key: ${QUERY_KEY}" "https://insights-api.newrelic.com/v1/accounts/${ACCOUNT_ID}/query?nrql=$NRQL_ENCODED"`

TOTAL=`echo $RESULT | jq '.totalResult.results[].sum'`
echo "TOTAL=${TOTAL}"
if [ $TOTAL -ge 53687091200 ]
then
  echo 'Total traffic is over 50G'
  exit 1
fi
if [ $TOTAL -ge 107374182400 ]
then
  echo 'Total traffic is over 100G'
  exit 2
fi

BYIP=`echo $RESULT | jq '.facets[0].results[].sum'`
echo "BYIP=${BYIP}"
if [ $BYIP -ge 3221225472 ]
then
  echo 'BYIP traffic is over 3G'
  REMOTE_ADDR=`echo $RESULT | jq -r '.facets[0].name'`
  NRQL="SELECT * from S3Logs where remoteAddr = '${REMOTE_ADDR}' SINCE 3 hours ago"
  NRQL_ENCODED=`echo "$NRQL" | sed 's/ /%20/g' | sed 's/(/%28/g' | sed 's/)/%29/g' `
  RESULT=`curl -s -H "Accept: application/json" -H "X-Query-Key: ${QUERY_KEY}" "https://insights-api.newrelic.com/v1/accounts/${ACCOUNT_ID}/query?nrql=$NRQL_ENCODED"`
  echo "Here's last access of ${REMOTE_ADDR}"
  echo $RESULT | jq '.results[].events[0]'
  echo "Run '${NRQL}' on Insights for detail"
  exit 1
fi
The interesting point here is where I send an NRQL query to a REST API endpoint using curl:
curl -s -H "Accept: application/json" -H "X-Query-Key: ${QUERY_KEY}" "https://insights-api.newrelic.com/v1/accounts/${ACCOUNT_ID}/query?nrql=$NRQL_ENCODED"`
I use the jq command to extract relevant data from the results, which are delivered in JSON format.
I’m checking two things here: total traffic and traffic per IP address. If either of these totals rises above a given threshold, Sensu triggers an alert.
When an alert is fired, I open up Insights and check the log results.
Serverless Monitoring
The great thing about AWS Lambda is that once you get it going, you can mostly just let it run on its own.
Originally I was running a cron job which pulled down S3 logs to an EC2 instance and then analyzed them, but then you need to monitor the cron job that is downloading the logs. You also need to watch a bunch of other things: Is there enough disk space? Have you installed the latest security updates? And so on.
For a server hosting your main application, these costs are worthwhile, but we’d like to avoid any additional maintenance costs for servers that perform secondary functions. Any server, regardless of the importance of the role it is playing, can cause unexpected problems if left unattended.
In general at Degica, we try to use external services like New Relic wherever possible to avoid these costs. The problem though is that external services are never as customizable or flexible as a server that you host and control yourself.
What I’ve tried to show here, though, is that by combining AWS Lambda with an external service, it’s possible to strike a balance between these two.
With that in mind, I thought I would take the opportunity here to see if I could use Lambda to go beyond just logs and actually use it for monitoring.
To do this, I use a feature whereby AWS Lambda allows you to run a given function at regular time intervals. I registered the code below and run it regularly such that it triggers warnings on slack if results exceed a given threshold (note that the code is very simple and does not handle errors or anything else):
if (event.source === 'aws.events') {
  const { accountId, queryKey } = insightsConfig;
  const query = "SELECT sum(sent) FROM S3Logs  FACET remoteAddr SINCE 2 hours ago";
  const options = {
    uri: `https://insights-api.newrelic.com/v1/accounts/${accountId}/query?nrql=${encodeURIComponent(query)}`,
    headers: {
      "Content-Type": "application/json",
       "X-Query-Key": queryKey
    }
  };
  request.get(options, (error, response, body)=>{
    if (!error && response.statusCode == 200) {
      // console.log(`success response=${JSON.stringify(response)} body=${body}`);
      const j = JSON.parse(body);
      const sumSentMax = j.facets[0].results[0].sum;
      console.log(`sum=${sumSentMax}`);
      if (sumSentMax > 1024 * 1024 * 1024) {
        const msg = `s3 traffic is ${sumSentMax} from ${j.facets[0].name}`;
        const {slackOpts} = insightsConfig;
        const options = {
          uri: 'https://slack.com/api/chat.postMessage',
          form: {
            token: slackOpts.token,
            channel: slackOpts.channel,
            text: msg,
            username: slackOpts.username
          }
        };
        request.post(options, (error, response, body)=>{
          console.log(`posted to slack ${response}`);
        });
      };
      context.succeed('success');
    } else {
      console.log(`error ${error}`);
      console.log(`response=${JSON.stringify(response)}`);
      context.fail(`Insights api returns error ${error}`);
    }
  });
}
As is, this code will send the same warning message many times once it passes the threshold, but it as a minimal proof-of-concept it works.
Using AWS Lambda in this way, I think we can decrease our dependency on EC2 instances for tasks like this.